We expect no clean equivalence between infrastructure, labor, capital, and internet development. Still, we know that the growth of a robust modern internet takes vast amounts of time, skilled labor, and knowledge — all elements of advanced capital. So, when we consider the rise of today’s African internet, we must ask, first, who builds it — and then, where its infrastructure overlaps or clashes with existing geographical patterns. Heavily visual organization and logic help think through these issues of backbone, traffic, and investment. Their combination leads to some interesting insight to the specific challenges facing the continuation of Africa’s internet-building.
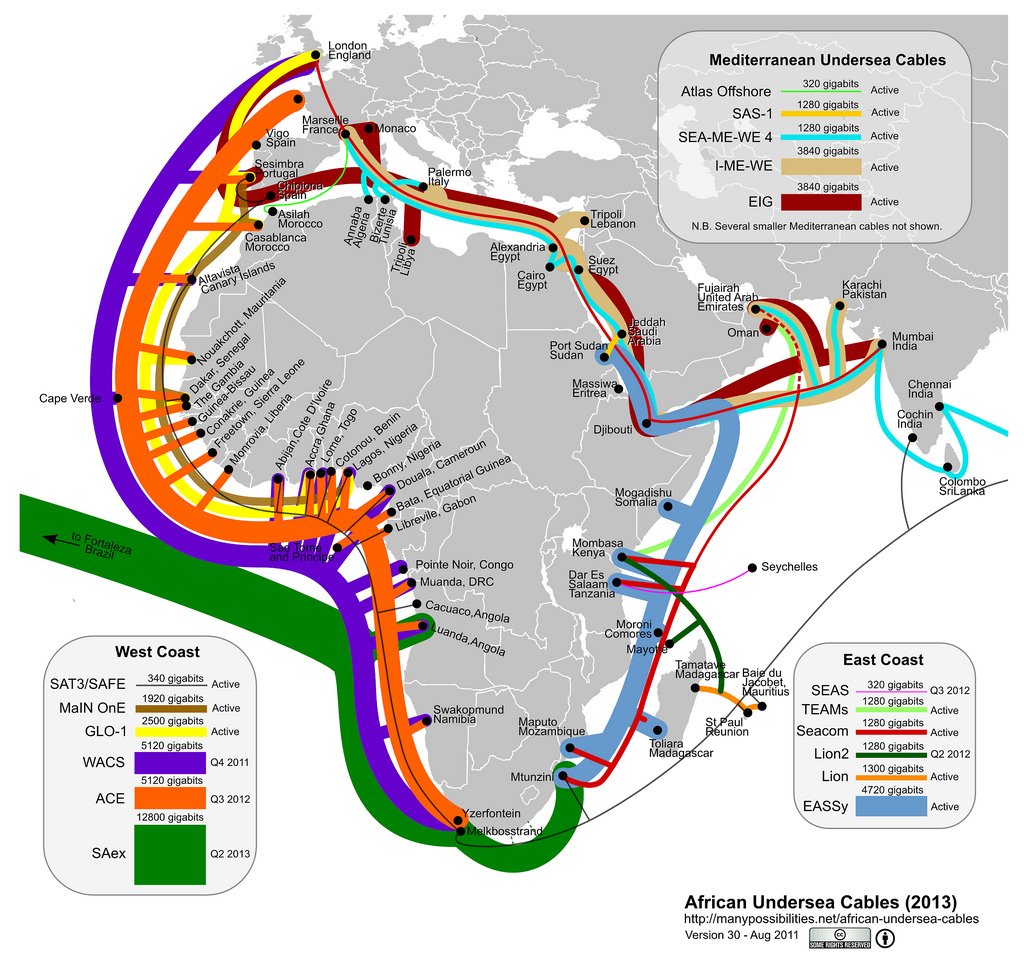
First, turn to this elegantly isometric map of the existing and nearly-completed fiber optic offshore lines that constitute the global internet backbone:
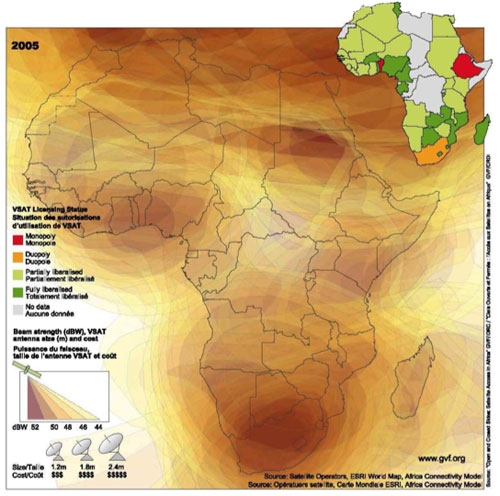
and compare that to the following map, of satellite coverage across the continent:
One must notice, here, the density of base-level internet infrastructure around the continent; in particular, the dozen or so landing points on the Bight of Benin for the largest fiber-optic cables in the world, and the thick, overlapping satellite networks that serve the same region. These note a strange inconsistency between the potential in these networks to serve vast quantities of data to huge groups of people at unprecedented speeds, and the persistent lag in uptake on behalf of Africans in the region, only a fraction of whom use the internet on any regular basis. Further, that use is largely relegated — even today — to cellular proxies and/or to institutional settings, such as internet cafes, libraries, schools, government buildings, and military settings. That such a small portion of the many citizens of this region use internet access is evidenced by the next image.
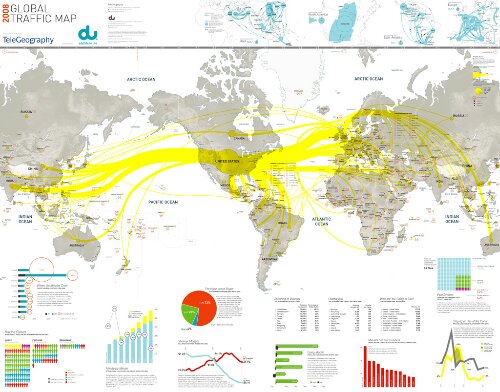
This map (which cannot, unfortunately, be zoomed in on until I pay several hundred dollars for a JPG — donations welcome) demonstrates the movement of internet traffic, measured in packets switched between nodes. Even at this great distance, it is plain to see how little data flows through African territory. The region of West Africa on which so much of my future research will focus, in particular, serves so few bits to the rest of the world that the entrance on its coastline of such massive new fiberoptic infrastructure strikes a dissonant chord. There must, in short, be reasons other than demand at work here. One place we may find them is in capital flows — two ways to map these follow.
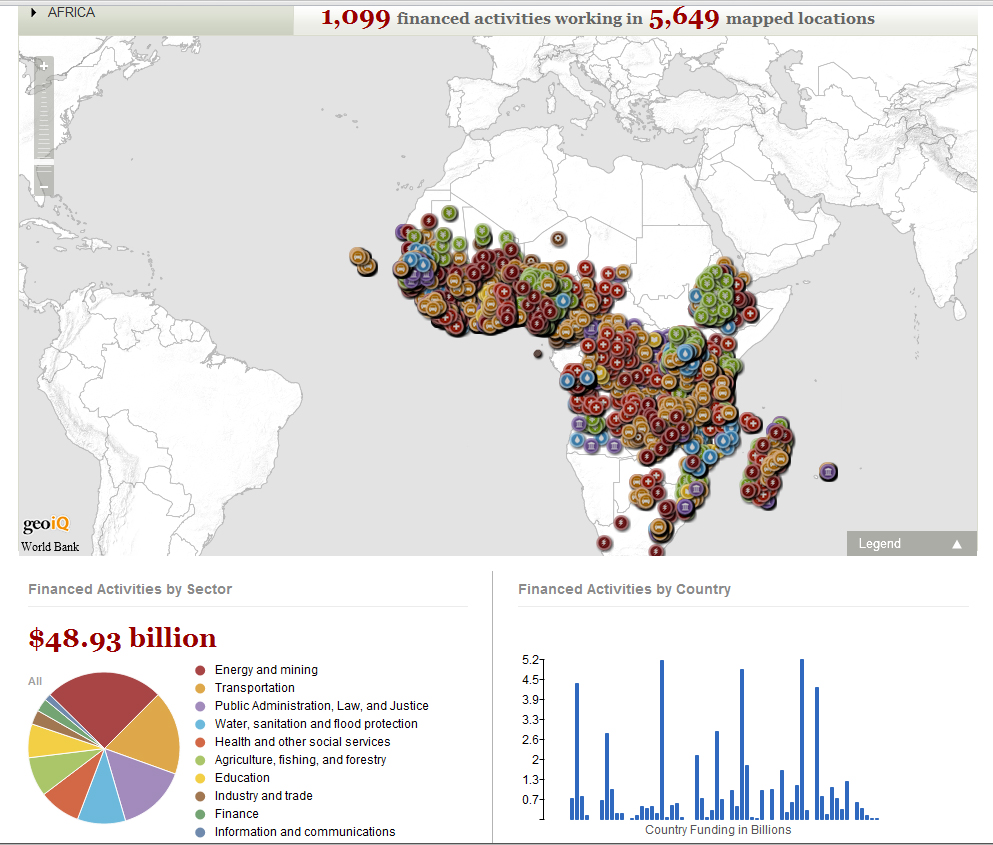
The above map, provided by World Bank data and programming, details the thousands of projects underway across sub-Saharan Africa today. These markers of international aid investment point out, clearly, how much non-African capital is present in these discussions of an African internet. They are made still more explicit by the final image of the week — a map generated through GapMinder’s data sets and visualization tools, of regional economic strength, measured in PPP, compared with the amount of Internet users.
www.bit.ly/zwtLqu
What that last map demonstrates strikes home.
First, the number of internet users, number of computer owners, technological penetration, amount of investment in technology, economic strength, and conditions for both local economic growth and local internet superstructure remain strongly divided from the rest of the internetting world. Second, the data available to study this division — a modern digital divide without irony — increase daily, but so does the quality and ease of the tools necessary to parse all that data. The project of the next week’s post will be to begin breaking down the assumptions that attend to and often constrain studies of the global Internet, in light of this challenging opportunity.


